RPC Statistics
Please be advised that these tools and services will be discontinued soon.
Inspect your RPC Usage in the Statistics Tab:

Data defaults to the last 30 days. Currently the statistics page show the usage data across all projects and API keys within an organization set on Pagoda Console.
Aggregated key metrics available at the top of the dashboard are
- Total Request Volume
- Request Success Rate
- Total failed request
- Average Latency
Set a Time Period
Data is sent with UTC time to the browser and the browser adjusts to the user’s timezone.
- Last 15 Minutes is the last complete 15 minutes. This updates every few seconds.
- Last 1 Hour is the last fully completed hour; from 00 to 59 minutes and 59 seconds.
- Last 24 Hours is the last fully completed 24 consecutive hours.
- Last 7 Days is the previous 7 days from the current time. Each data point groups one hour’s worth of data. The most recent hour is partial data for the current hour and updates every few seconds.
- Last 30 Days is the previous 30 days from the current time. Each data point groups one hour’s worth of data. The most recent hour is partial data for the current hour and updates every few seconds.
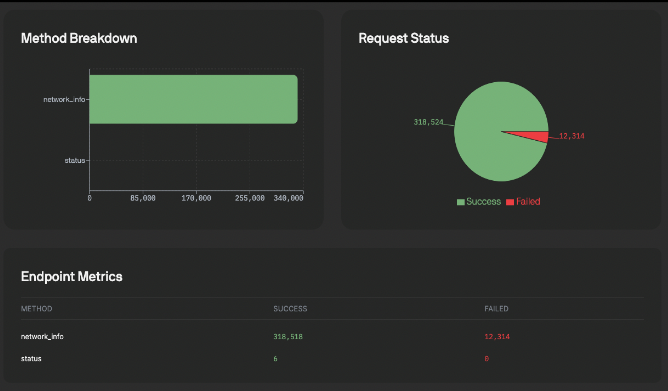
Requests breakdowns
Multiple breakdowns are available in the statistics page

Requests can be broken down by
- Requests Methods
- Requests Status
- Aggregated status display breakdown by requests methods
We are working to include more detailed breakdown by each requests and more interactive dashboard that enable clickthrough from the charts
Network Status
Check the Pagoda Status page for the latest service information across all networks and subscribe to updates based on your service choice and needs.


